

How It Works
Our engine processes your inputs using verified datasets and logic models to provide real-time results.
Efficiency Tips
Ensure data accuracy for the most reliable interpretation.
Compare results across different scenarios to find the optimal path.
Did you know?
Using standardized tools reduces manual error by up to 95% in complex calculations.
Related Expert Tools
More precision tools in the same niche.
Obsidian Hydration Dating Calculator
The Obsidian Hydration Dating Calculator converts a measured hydration rim thickness and a source-specific rate constant into an estimated age using the standard quadratic diffusion relationship. Its calibration mode works the same relationship in reverse, deriving a local rate constant from a rim measured on obsidian associated with an independently dated context, the real method used to establish rate constants for a given obsidian source.
Pollen Count Percentage Calculator
The Pollen Count Percentage Calculator works out each taxon's percentage of the pollen sum, following the standard convention of excluding aquatic taxa, sedges, and spores from the sum itself. It also calculates the arboreal-to-non-arboreal (AP:NAP) ratio used to gauge forest cover and land clearance, plus a 95% confidence interval for a reported percentage based on total count size.
Soil Layer Depth Calculator
The Soil Layer Depth Calculator converts a field depth-below-datum (DBD) reading into an absolute site elevation, accounting for a separate unit datum offset where used. It also calculates a stratum's average thickness, thickness range, and estimated volume from top and bottom DBD readings taken at multiple points across an excavation unit's floor, flagging strata that slope noticeably from corner to corner.
Dendrochronology Alignment Calculator Logic
Why a Tree-Ring Date Isn't a Construction Date
The mistake I see most often is treating a tree-ring date as automatically equal to the date an artifact or structure was actually made or used. A dendrochronological date tells you when a ring formed, and at best when the tree was felled if bark or the bark edge survives; it says nothing on its own about how long the wood then sat in storage, was reused from an earlier structure, or was carved from heartwood laid down decades before the tree died. Always check whether a sample retains its outermost, bark-edge ring before treating a felling date as secure, and treat any sample missing that edge as giving only a "terminus post quem," a date after which the tree was felled, not a precise felling year. This distinction is central to what dendroarchaeology describes as the gap between a tree-ring date and the actual construction or use event.
What the Dendrochronology Alignment Calculator Actually Does
This tool works out two of the core statistics dendrochronologists use to test whether an undated tree-ring series crossdates against a reference chronology: Gleichläufigkeit (GLK), and the Baillie and Pilcher t-value. According to the Laboratory of Tree-Ring Research's overview of crossdating, crossdating is the basic principle underlying all of dendrochronology: matching a pattern of wide and narrow rings from a new sample against a master chronology built up, year by year, from overlapping living and historic trees.
Gleichläufigkeit (GLK) and the Baillie-Pilcher t-value
t-value | General Interpretation |
|---|---|
Below 3.5 | Below the traditional significance threshold |
3.5 to 4.0 | Marginal; needs visual confirmation before acceptance |
4.0 and above | Strong statistical match by modern oak-dating convention |
GLK, the percentage of parallel variation, checks whether both series moved in the same direction from year to year and divides agreeing intervals by total comparable intervals. The t-value converts the Pearson correlation between two series into a significance statistic accounting for overlap length: t equals r times the square root of n minus 2, divided by the square root of 1 minus r squared. Baillie and Pilcher originally proposed 3.5 as a threshold; many labs now treat 4.0 as the working baseline for oak, a revision an empirically-determined study for British Isles oak broadly supports. GLK is more commonly used in European dendrochronology while t-value dominates practice in the US, and the two measures can disagree at a given position, so research on the Gleichläufigkeitskoeffizient recommends using both together.
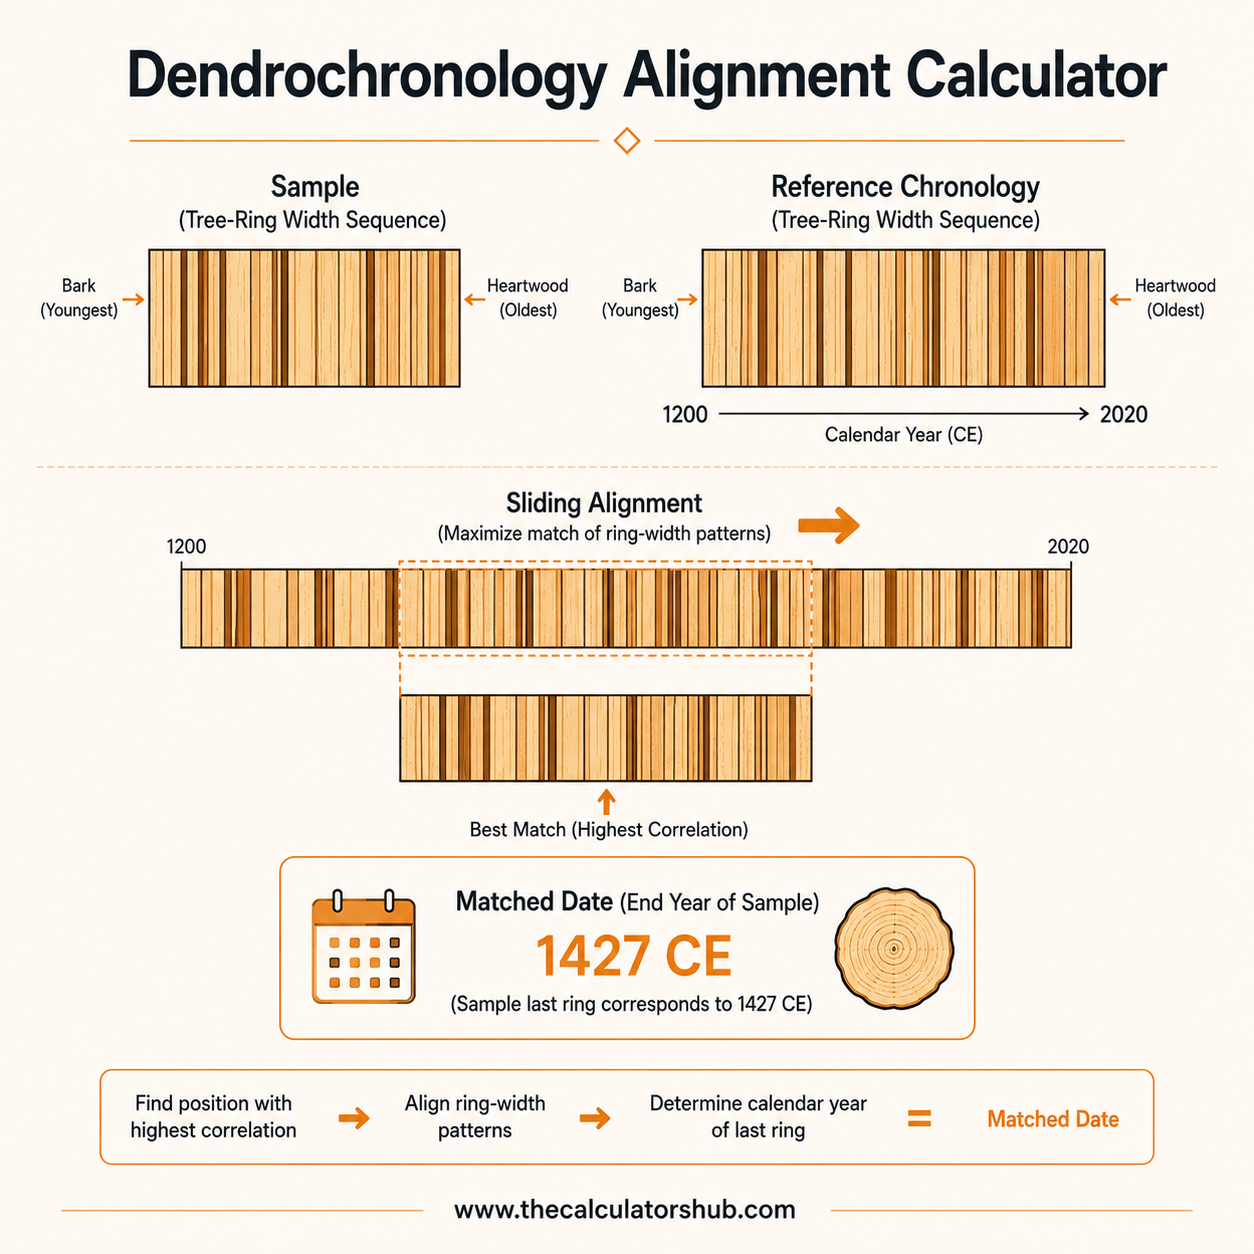
Searching for the Best-Fit Offset
An undated, "floating" tree-ring sample does not arrive with a known position against the master chronology, so dendrochronologists test many candidate offsets and rank the results by statistical strength. A genuinely secure crossdate should show one offset scoring well above all the others; two offsets with similarly strong t-values sitting close together is a real warning sign that the match is ambiguous rather than settled. This sliding-window approach follows the same logic used by dedicated professional software; the CROSSDATE program overview describes tools built specifically to test a sample against many candidate positions before settling on one.
Accuracy and Limitations
The correlation, t-value, and GLK arithmetic here is exact given the ring-width index values supplied. This calculator does not perform ring-width standardization or detrending; it assumes already-standardized index values, the kind produced by curve-fitting software such as ARSTAN or the dplR Dendrochronology Program Library in R, since raw widths carry an age-related growth trend that would bias a direct correlation. A statistical match, however strong, is also not a confirmed date on its own; the field's own practice always follows a promising statistical hit with visual pattern confirmation via skeleton plotting before a date is formally accepted.
Why Dendrochronology Matters for Radiocarbon Dating
Long, continuous tree-ring chronologies, cross-dated back thousands of years, provide the annually-resolved wood samples used to build and calibrate the radiocarbon calibration curve itself, since each ring's calendar year is known independently of radiocarbon and can be directly compared to that ring's measured radiocarbon content. Once a wood sample's date is established, our Radiocarbon Calibration Calculator relies on exactly this kind of dendrochronological data, and the Pollen Count Percentage Calculator can help place the same context within its broader environmental sequence.
Frequently Asked Questions

Muhammad Shahbaz Siddiqui
Founder, TheCalculatorsHub
How I used the Dendrochronology Alignment Calculator to flag an ambiguous crossdate before it was published as a firm date
A colleague working on a historic timber-framed barn brought me a felling date to sanity-check back in 2010, for one of its main roof beams. The lab's report cited a single t-value of 4.1 against the regional master chronology at one specific offset, comfortably above the modern 4.0 threshold often used for oak, and the report's draft language treated the date as settled.
Running the same floating series through a full offset search rather than checking the single reported position told a more complicated story: a second candidate offset, 34 years away from the reported one, scored a t-value of 3.9, uncomfortably close to the accepted match rather than a clear runner-up. Neither position could be ruled out on the correlation statistics alone, and the GLK scores for the two candidates, 71% and 68%, were similarly close rather than one clearly outperforming the other.
The lab pulled the original skeleton plots for both candidate positions and, on visual inspection, the reported offset showed a cleaner match on the distinctive narrow-ring marker years the regional chronology is known for, while the alternative did not. The felling date was confirmed, but the final report was revised to explicitly note that a second statistically close candidate had been tested and ruled out visually, rather than presenting the single accepted t-value as if no ambiguity had existed at all.