

How It Works
Our engine processes your inputs using verified datasets and logic models to provide real-time results.
Efficiency Tips
Ensure data accuracy for the most reliable interpretation.
Compare results across different scenarios to find the optimal path.
Did you know?
Using standardized tools reduces manual error by up to 95% in complex calculations.
Related Expert Tools
More precision tools in the same niche.
Artifact Density Calculator
The Artifact Density Calculator works out area density (per square metre) and volume density (per cubic metre) from your excavation unit dimensions and artifact counts. It also breaks results down by artifact class, such as ceramics, lithics, and faunal bone, so compositional differences between units are visible alongside the overall density figure.
Bone Fragmentation Index Calculator
The Bone Fragmentation Index Calculator works out the NISP:MNE ratio per taxon and skeletal element, or a weighted average bone completeness percentage from recorded portion brackets. It includes a built-in caution about the equifinality problem, since carnivore gnawing, trampling, and sediment attrition can all produce a high fragmentation ratio that looks statistically similar to intensive human butchery.
MNI Calculator
The MNI Calculator works out the Minimum Number of Individuals in a skeletal assemblage from left- and right-side element counts, taking the highest single-element contribution as the overall figure. It also compares MNI against NISP and includes a two-context comparison mode that shows how summed and pooled MNI can disagree, a known non-additivity property of the method.
Pottery Sherd Estimator Logic
Why Sherd Count Alone Misrepresents Ware Proportions
The mistake I see most often is reporting sherd count alone as though it directly reflects how many vessels of each ware were present, when count is specifically the measure most distorted by differential breakage between fabrics. Always calculate EVE alongside count and weight whenever rim sherds are present in sufficient numbers, and flag any case where the methods disagree by a wide margin rather than quietly picking whichever number supports the interpretation already in mind. Be transparent about which method underlies any stated proportion; the Chartered Institute for Archaeologists' pottery recording toolkit treats consistent methodology within a period specialism as a requirement, not a preference.
What the Pottery Sherd Estimator Actually Does
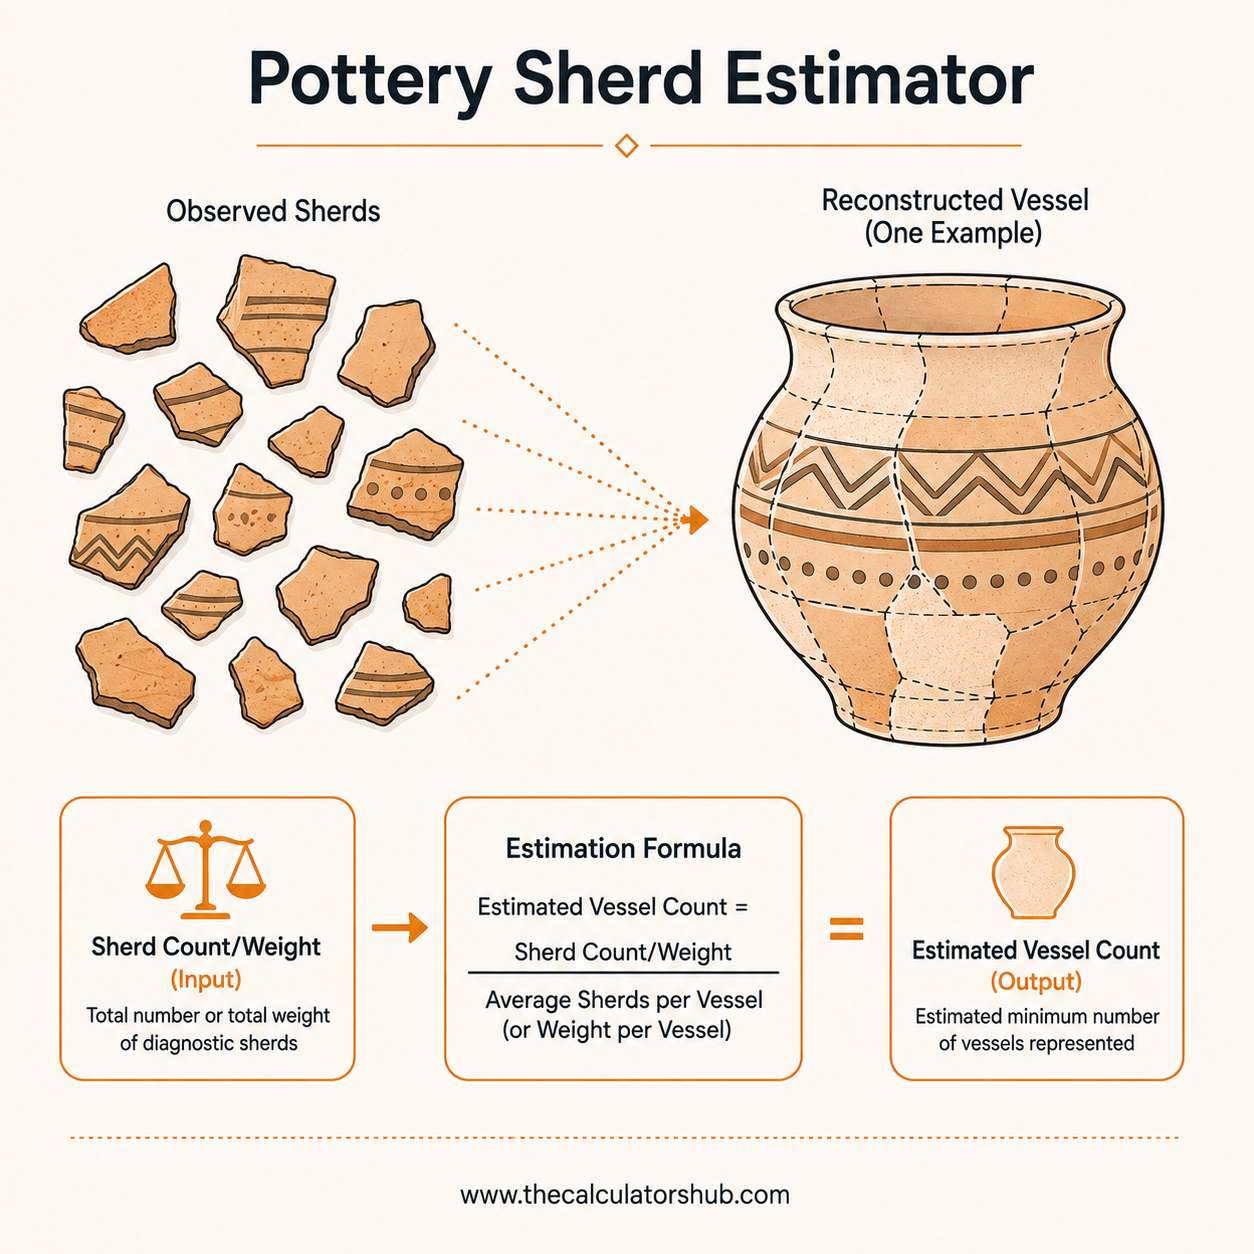
This tool works out three different quantification measures for a ceramic assemblage, sherd count, sherd weight, and Estimated Vessel Equivalent (EVE), so you can compare how each one represents the true proportions of ware types in a collection. Archaeologists use these figures to characterize a site's ceramic economy, compare assemblages between sites, and track how ware proportions change across a sequence. According to Orton and Tyers' foundational statistical work on ceramic assemblage quantification, the vessel-equivalent measure is the only one of the common methods that gives an unbiased estimate of true ware proportions.
Sherd Count and Weight: Two Simple but Biased Methods
Method | What It Measures | Main Bias |
|---|---|---|
Sherd count | Number of identifiable fragments | Overstates wares that fragment more finely |
Sherd weight | Total mass by ware | Overstates thick, heavy fabrics |
EVE (rim %) | Proportion of rim circumference represented | Least biased; still needs enough rim sherds to be reliable |
Sherd count is directly biased by how finely a vessel happens to have broken: a thin, brittle fineware vessel can shatter into far more countable fragments than a thick-walled coarseware vessel, inflating the fineware's apparent share purely from breakage pattern. Sherd weight corrects some of this bias but introduces its own, since thick fabrics like amphorae weigh disproportionately more per vessel than thin finewares. Neither measure alone reliably answers how many vessels of each ware were really present.
Estimated Vessel Equivalent (EVE): The Unbiased Standard
EVE measures the percentage of a vessel's rim circumference each rim sherd represents, using a rim chart, then sums those percentages across all sherds of a given ware. A complete rim scores 100%; fragments totalling 180% give an EVE of 1.8 for that ware. Because the measure is based on the surviving proportion of a standardized reference point rather than fragment count or mass, it is not distorted by how completely or finely individual vessels broke. Rim charts are freely available through resources such as the Potsherd pottery research reference site's tools page.
Why the Three Methods Can Disagree Dramatically
A coarseware that dominates by sherd count can genuinely represent fewer actual vessels than a fineware once EVE is calculated, if the coarseware happened to break into many more countable pieces per vessel. This calculator flags a meaningful spread automatically, since a large gap between a ware's count-based and EVE-based share is exactly where relying on count alone would produce a misleading picture, a divergence Orton and Tyers' statistical treatment of ceramic assemblages addresses directly. Check your assemblage's rim sherd coverage before assuming EVE alone tells the whole story, since prehistoric or heavily worn pottery without identifiable rim profiles often cannot be quantified by EVE at all.
Accuracy and Limitations
The arithmetic here, summing counts, weights, and rim percentages and converting each to a proportional share, is exact given accurate input data. EVE still depends on having enough rim sherds recorded to be statistically meaningful; a ware represented by only one or two small rim fragments can produce a technically unbiased but practically unreliable figure. It's also worth knowing EVE and simpler maximum-vessel-count methods do not always agree even when both are calculable; CIfA's guidance notes rim-based EVE often produces lower vessel estimates than a maximum vessel count approach, so state clearly which method underlies any figure you report.
Frequently Asked Questions

Muhammad Shahbaz Siddiqui
Founder, TheCalculatorsHub
How I used the Pottery Sherd Estimator to correct a misleading claim about a site's ceramic economy
A post-excavation report draft landed on my desk in 2023 claiming a Roman-period site was dominated by coarseware pottery, based on a sherd count showing coarseware at nearly 77% of the total assemblage by fragment count, with fineware barely registering at under 17%. The report used this to argue the site had limited access to higher-status finewares, feeding into a broader interpretation about the settlement's economic standing.
Running the same assemblage through the EVE (Estimated Vessel Equivalent) calculation, using the rim percentages already recorded in the site's finds catalogue but never actually summed into a vessel-equivalent figure, told a strikingly different story. By EVE, fineware represented the largest share of the assemblage at just over 54%, more than the coarseware's 37.5%, essentially inverting the count-based ranking. Orton and Tyers' foundational statistical work on ceramic assemblage quantification explains exactly why this happens: sherd count is biased toward wares that break into more, smaller fragments per vessel, while EVE measures the actual proportion of vessels represented and is not affected by how completely or how finely a vessel happens to have broken.
The excavation director revised the report's economic interpretation entirely, since the EVE-based figures suggested meaningful access to fineware vessels rather than a coarseware-dominated assemblage, a materially different conclusion for a site economy argument. The team adopted a standing practice of reporting count, weight, and EVE figures together going forward rather than defaulting to count alone, specifically because the gap between methods had turned out to matter for a real interpretive claim rather than being a minor statistical footnote.