

How It Works
Our engine processes your inputs using verified datasets and logic models to provide real-time results.
Efficiency Tips
Ensure data accuracy for the most reliable interpretation.
Compare results across different scenarios to find the optimal path.
Did you know?
Using standardized tools reduces manual error by up to 95% in complex calculations.
Related Expert Tools
More precision tools in the same niche.
Artifact Density Calculator
The Artifact Density Calculator works out area density (per square metre) and volume density (per cubic metre) from your excavation unit dimensions and artifact counts. It also breaks results down by artifact class, such as ceramics, lithics, and faunal bone, so compositional differences between units are visible alongside the overall density figure.
MNI Calculator
The MNI Calculator works out the Minimum Number of Individuals in a skeletal assemblage from left- and right-side element counts, taking the highest single-element contribution as the overall figure. It also compares MNI against NISP and includes a two-context comparison mode that shows how summed and pooled MNI can disagree, a known non-additivity property of the method.
Pottery Sherd Estimator
The Pottery Sherd Estimator calculates sherd count, sherd weight, and Estimated Vessel Equivalent (EVE) for each ware type in a ceramic assemblage, then compares their percentage shares side by side. It flags cases where count-based and EVE-based proportions diverge significantly, since sherd count is biased toward wares that fragment more finely while EVE gives an unbiased estimate of true vessel proportions.
Bone Fragmentation Index Calculator Logic
Why High Fragmentation Doesn't Prove Butchery
The mistake I see most often is treating a high NISP:MNE ratio as self-evident proof of intensive butchery or marrow extraction without checking for alternative causes first. Always pair a fragmentation figure with independent evidence such as cut marks or burning before building an interpretation around it, since equifinal processes can produce a statistically similar ratio for entirely different underlying reasons. Compare fragmentation across elements and taxa within the same assemblage rather than judging one figure against a fixed universal threshold, in line with how comparative NISP and MNE research in cutmark analysis treats fragmentation as one line of evidence to weigh alongside others rather than a standalone verdict.
What the Bone Fragmentation Index Calculator Actually Does
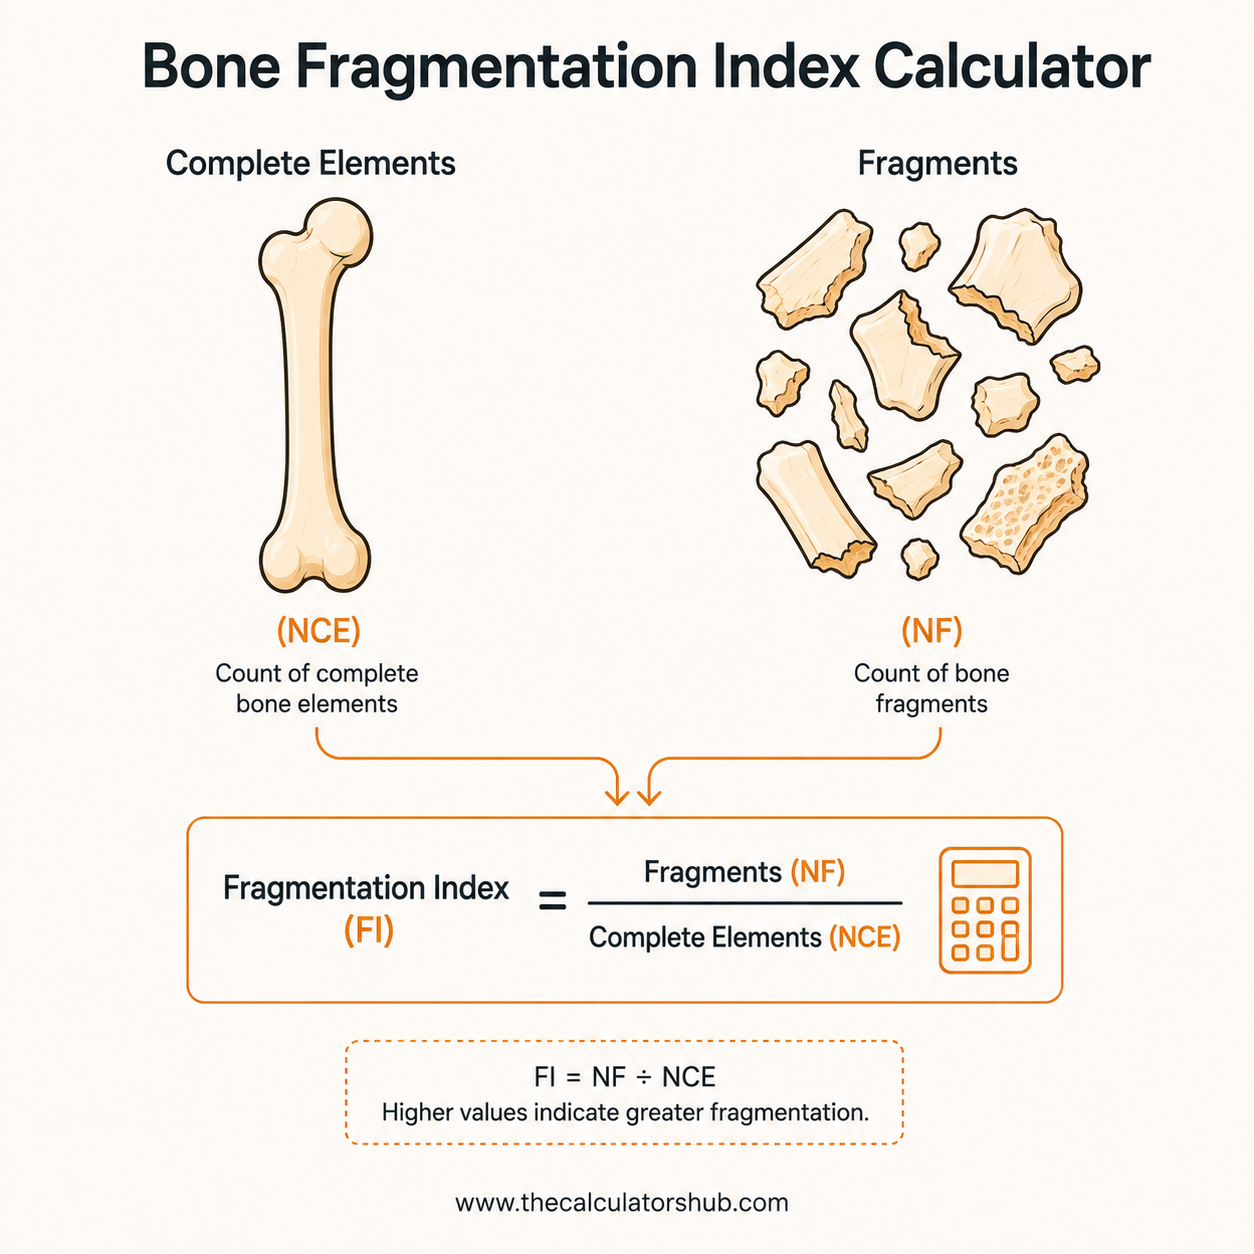
This tool works out how fragmented a faunal assemblage is, using either the standard NISP:MNE ratio per taxon and element or a weighted average completeness percentage from recorded portion brackets. Zooarchaeologists use fragmentation measures to investigate butchery intensity, marrow and grease extraction, carnivore activity, and site formation processes. According to research published in the Journal of Archaeological Method and Theory, fragmentation intensity is a basic zooarchaeological variable tied directly to in-situ attrition, human butchery, and an assemblage's broader taphonomic history.
How the NISP:MNE Ratio Is Calculated
NISP:MNE Ratio | General Interpretation |
|---|---|
Below 1.8 | Low fragmentation; elements largely intact |
1.8 to 3.0 | Moderate fragmentation |
Above 3.0 | High fragmentation; each element broke into several identifiable pieces on average |
For each taxon and skeletal element, divide the Number of Identified Specimens (NISP), the raw fragment count, by the Minimum Number of Elements (MNE), the estimated number of whole elements those fragments represent. A cattle femur with 24 identified fragments representing an estimated 6 actual femurs gives a ratio of 4.0. These bands are a general guide rather than a fixed disciplinary standard, since fragmentation intensity varies with an element's shape, density, and the taxon's body size, so comparing a ratio against other elements within the same assemblage is generally more informative than judging it in isolation.
Average Completeness: An Alternative Fragmentation Measure
Some recording systems instead score each identified element's completeness in brackets, such as under 25%, 25 to 50%, 50 to 75%, and complete, rather than tallying NISP and MNE separately. A weighted average completeness percentage across all recorded elements moves inversely to fragmentation: lower completeness corresponds to a more fragmented assemblage. Bone density research in zooarchaeology associated with R. Lee Lyman's foundational work shows denser skeletal portions consistently survive post-depositional attrition better than fragile ones, so a low completeness figure concentrated in low-density elements points toward preservation bias rather than genuine butchery-driven fragmentation.
The Equifinality Problem
Research on equifinal, random fragmentation processes has shown that bone fragment-size distributions can fit closely similar statistical patterns regardless of the actual cause, meaning carnivore gnawing, trampling, sediment compaction, and ordinary post-depositional attrition can all produce a high NISP:MNE ratio that looks statistically indistinguishable from intensive human butchery based on the ratio alone. Once fragmentation and butchery evidence are both assessed, our MNI Calculator can help establish how many individual animals the same assemblage actually represents.
Accuracy and Limitations
The ratio and weighted-average arithmetic here are exact given accurate NISP, MNE, or bracket count data. That said, MNE itself involves analyst judgment about which fragments belong to the same original element, so the ratio inherits whatever uncertainty exists in that upstream identification work. This calculator cannot determine the cause of a given fragmentation level; it reports the degree of fragmentation only, and interpreting why an assemblage is fragmented requires the independent taphonomic evidence discussed above. Some analysts base MNE specifically on shaft portions rather than fragile articular ends, an approach known as the "shaft critique," which this calculator does not apply automatically since it depends on which portion your own recording protocol used.
Frequently Asked Questions

Muhammad Shahbaz Siddiqui
Founder, TheCalculatorsHub
How I used the Bone Fragmentation Index Calculator to stop an overreaching claim about intensive butchery
A student's draft chapter, back in 2018, argued that unusually high bone fragmentation at a cattle-dominated faunal assemblage was strong evidence of intensive marrow extraction and heavy butchery pressure, citing a cattle femur NISP:MNE ratio of 4.0 as the centerpiece of the argument. The framing treated the high ratio almost as proof on its own, with cut mark and burning evidence mentioned only briefly afterward as supporting detail.
Running the full element breakdown through the calculator showed the femur's ratio of 4.0 sitting well above the cattle mandible's ratio of 1.125 from the same assemblage, a genuinely large internal spread worth investigating rather than dismissing. But checking the wider taphonomic literature on fragmentation before finalizing the interpretation surfaced an important caution: research on equifinal, random fragmentation processes in zooarchaeological assemblages has shown that bone fragment-size distributions can fit similar statistical patterns regardless of the underlying cause, meaning carnivore gnawing, trampling, and post-depositional sediment pressure can all produce a high NISP:MNE ratio that looks statistically identical to intensive human butchery on the ratio alone.
The student revised the chapter to present the fragmentation ratio as one line of evidence rather than the central proof, cross-checking it specifically against cut mark frequency and burning patterns on the same femur specimens before attributing the fragmentation to butchery intensity. The cut mark evidence held up and supported the original interpretation, but the revised chapter's methodology section was strengthened considerably by explicitly ruling out the alternative explanations rather than assuming the high ratio spoke for itself.